Woodforest Sales by Villages & Subdivisions
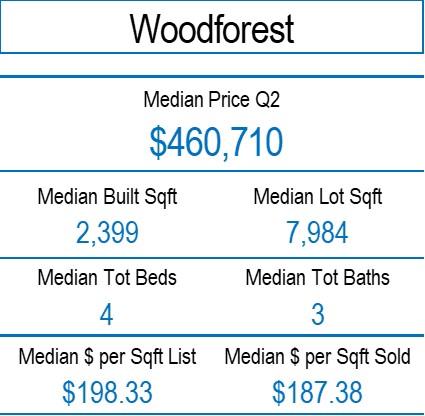
As always, we strive to keep our friends and clients informed about the housing market in our area. Using the information we gathered from the Houston Association of Realtors, we are happy to share with you the information below showing recent developments in the housing market in Woodforest area.

If you are browsing with mobile smartphone, rotate for better experience
Woodforest
Woodforest Sales December 2022
Highlights
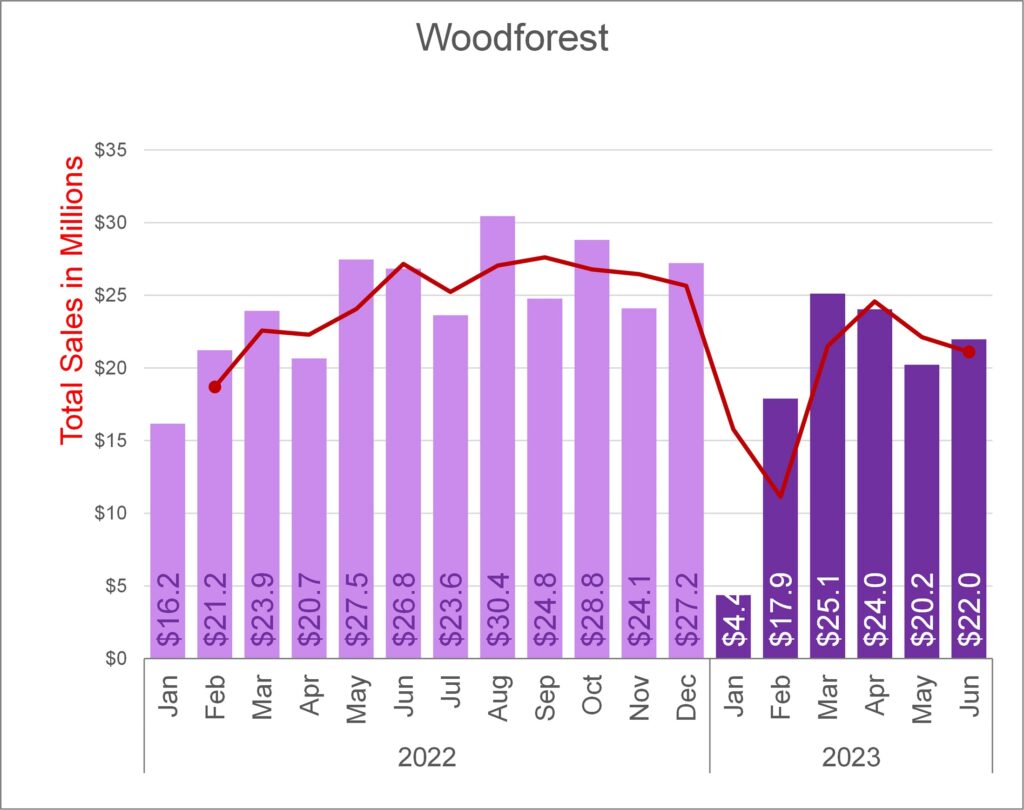
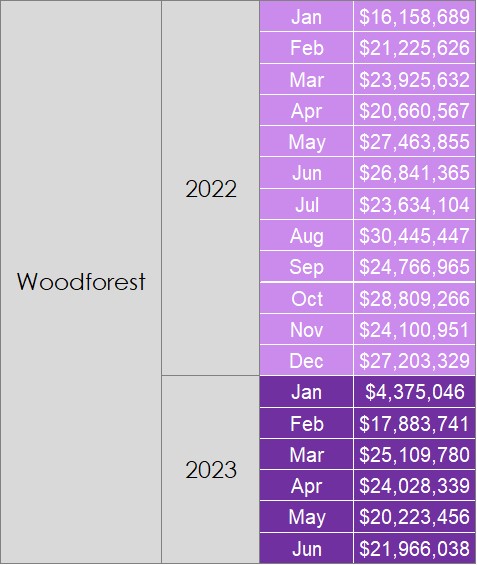
- 48 Houses Sold. Good pace continues.
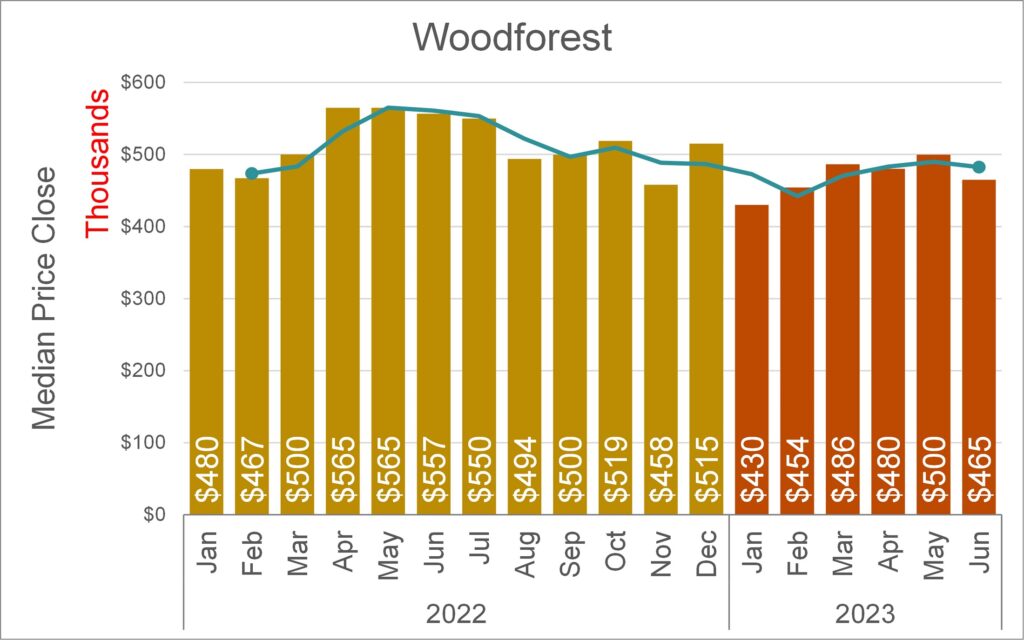
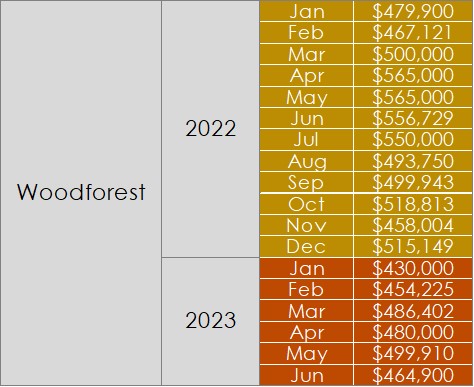
- Median Price Closed in December 2022 $515,149. Median Price Closed in November 2021 $449,000.
- 24 Houses in Active status.
- Very good month in sales with increase in units and in price.
- This area is still strong in today’s market.
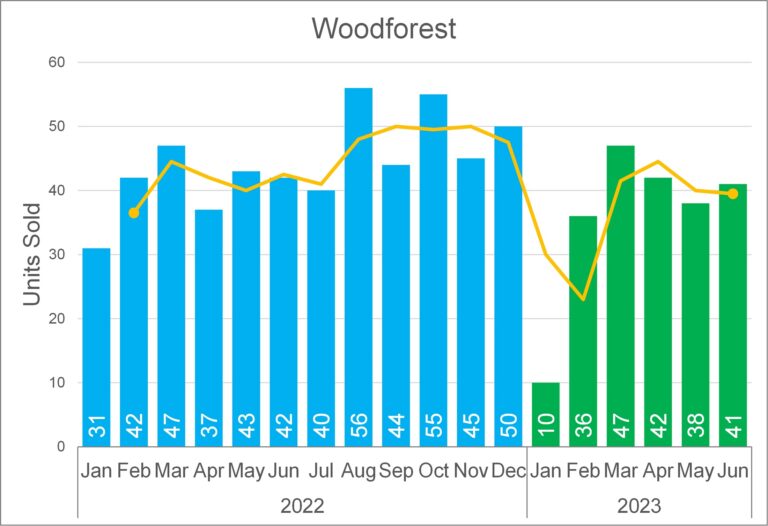
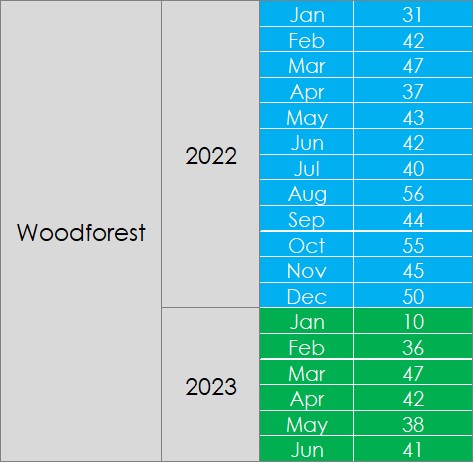
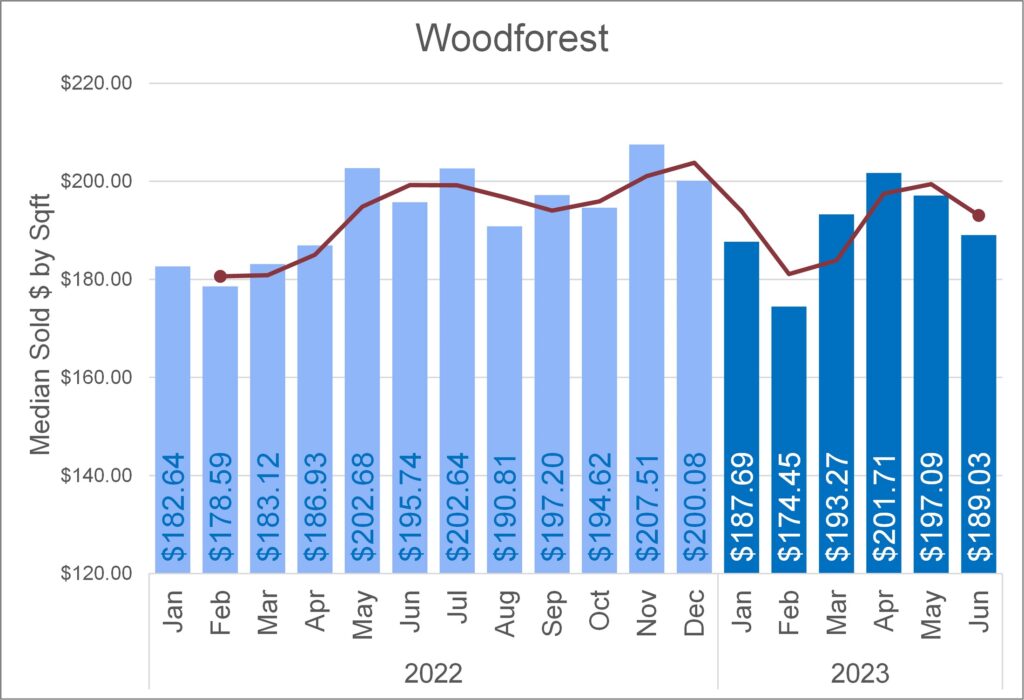
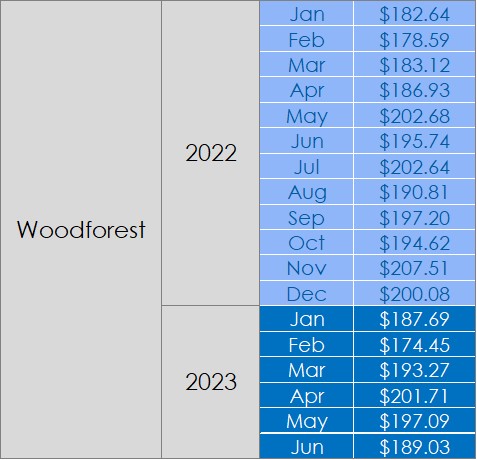
Trend by Month to Month

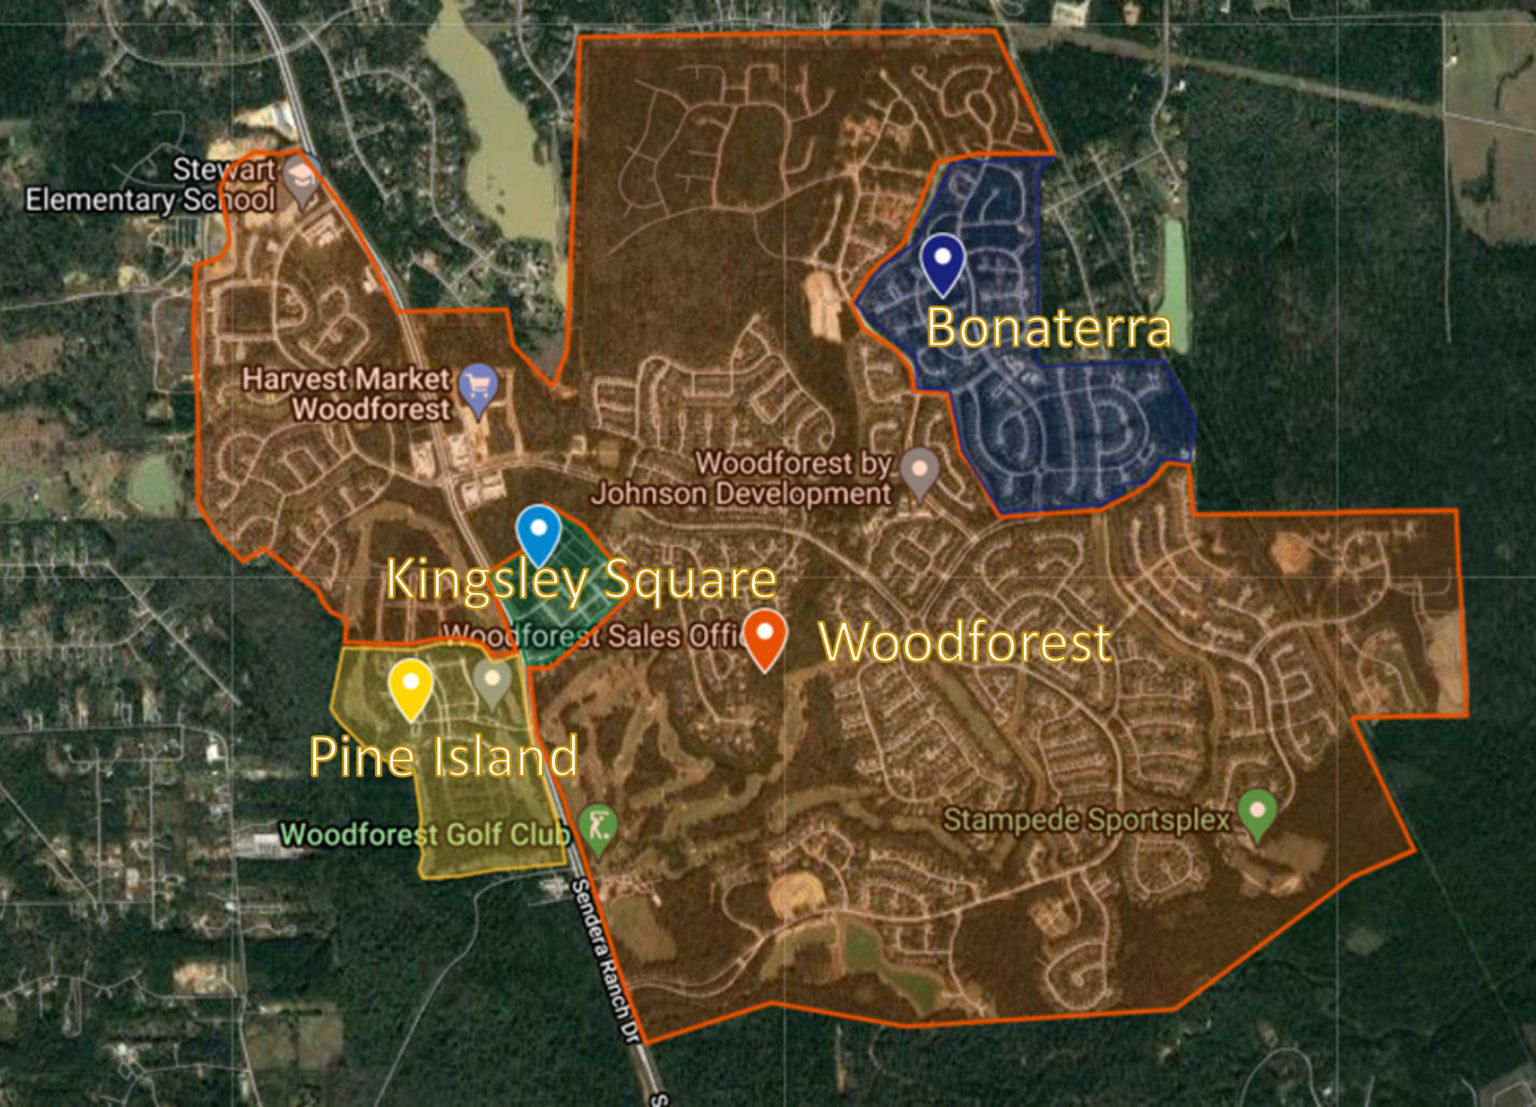
Map of Sales December 2022
Summary December 2022
wdt_ID | Concept | Count | Values |
---|---|---|---|
1 | Total Units Sold | 48 | 0 |
2 | Median Sqft Building | 2,683 | 0 |
3 | Avg. Num of Bedrooms | 4 | 0 |
4 | Avg. Total Baths | 2 | 0 |
5 | Median Price | 0 | 515,149 |
6 | Minimum Price | 0 | 286,140 |
7 | Maximum Price | 0 | 940,867 |
8 | Median $ Sqft Sold | 0 | 200 |
December 2022 - Sales Status by Village or Subdivision
wdt_ID | marketarea | Subdivision & Villages | Sold | Pending | Active | Withdraw | Total Status |
---|---|---|---|---|---|---|---|
1 | Woodforest | Bonterra | 5 | 2 | 2 | 0 | 9 |
2 | Woodforest | Elk-Trace Golf Estates | 0 | 0 | 0 | 1 | 1 |
3 | Woodforest | Kingsley Square | 2 | 0 | 1 | 0 | 3 |
4 | Woodforest | Noble Greens | 1 | 0 | 0 | 0 | 1 |
5 | Woodforest | Pine Island | 0 | 0 | 1 | 2 | 3 |
6 | Woodforest | Woodforest | 40 | 8 | 20 | 27 | 95 |
Tot 48 | Tot 10 | Tot 24 | Tot 30 | Tot 112 |
December 2022- Sold by Village or Subdivision.
Average, Minimum, Maximum Closed Price
wdt_ID | marketarea | Subdivision | Tot Units | Total | Minimum | Maximum | Median | Average |
---|---|---|---|---|---|---|---|---|
1 | Woodforest | Bonterra | 5 | 2,866,811 | 510,642 | 656,103 | 562,000 | 573,362 |
2 | Woodforest | Kingsley Square | 2 | 921,340 | 424,340 | 497,000 | 460,670 | 460,670 |
3 | Woodforest | Noble Greens | 1 | 750,000 | 750,000 | 750,000 | 750,000 | 750,000 |
4 | Woodforest | Woodforest | 40 | 21,615,727 | 286,140 | 940,867 | 502,500 | 540,393 |
Tot 48 | Tot 26,153,878 | |||||||
Min 286,140 | ||||||||
Max 940,867 |
December 2022 - Number of Houses Sold by Property Type
wdt_ID | marketarea | Subdivision & Villages | Single_Family | Townhouse/Condo | Total |
---|---|---|---|---|---|
1 | Woodforest | Bonterra | 5 | 0 | 5 |
2 | Woodforest | Kingsley Square | 2 | 0 | 2 |
3 | Woodforest | Noble Greens | 1 | 0 | 1 |
4 | Woodforest | Woodforest | 38 | 2 | 40 |
Tot 46 | Tot 2 | Tot 48 |
December 2022 - Number of Houses Sold by Building Size Grouped by Sqft.
wdt_ID | marketarea | Subdivision & Villages | 1000-1999-Sqft | 2000-2999-Sqft | 3000-3999-Sqft | Total |
---|---|---|---|---|---|---|
1 | Woodforest | Bonterra | 0 | 5 | 0 | 5 |
2 | Woodforest | Kingsley Square | 0 | 2 | 0 | 2 |
3 | Woodforest | Noble Greens | 0 | 0 | 1 | 1 |
4 | Woodforest | Woodforest | 7 | 16 | 17 | 40 |
Tot 7 | Tot 23 | Tot 18 | Tot 48 |
December 2022- Number of Houses Sold by Closed Price
wdt_ID | marketarea | Subdivision & Villages | $100-$299 KUSD | $300-$499 KUSD | $500-$699 KUSD | $700-$899 KUSD | $900-$1,099 KUSD | Total |
---|---|---|---|---|---|---|---|---|
1 | Woodforest | Bonterra | 0 | 0 | 5 | 0 | 0 | 5 |
2 | Woodforest | Kingsley Square | 0 | 2 | 0 | 0 | 0 | 2 |
3 | Woodforest | Noble Greens | 0 | 0 | 0 | 1 | 0 | 1 |
4 | Woodforest | Woodforest | 1 | 18 | 13 | 7 | 1 | 40 |
Tot 1 | Tot 20 | Tot 18 | Tot 8 | Tot 1 | Tot 48 |
December 2022- Number of Houses Sold by $ per Sqft
wdt_ID | marketarea | Subdivision & Villages | $100-$149 | $150-$199 | $200-$249 | $250-$299 | Total |
---|---|---|---|---|---|---|---|
1 | Woodforest | Bonterra | 0 | 0 | 4 | 1 | 5 |
2 | Woodforest | Kingsley Square | 0 | 1 | 1 | 0 | 2 |
3 | Woodforest | Noble Greens | 0 | 0 | 1 | 0 | 1 |
4 | Woodforest | Woodforest | 2 | 21 | 15 | 2 | 40 |
Tot 2 | Tot 22 | Tot 21 | Tot 3 | Tot 48 |
December 2022 - Number of Bedrooms by House Sold
wdt_ID | marketarea | Subdivision & Villages | 2 BDRM | 3 BDRM | 4 BDRM | 5 BDRM | Total |
---|---|---|---|---|---|---|---|
1 | Woodforest | Bonterra | 2 | 3 | 0 | 0 | 5 |
2 | Woodforest | Kingsley Square | 0 | 2 | 0 | 0 | 2 |
3 | Woodforest | Noble Greens | 0 | 0 | 1 | 0 | 1 |
4 | Woodforest | Woodforest | 0 | 12 | 21 | 7 | 40 |
Tot 2 | Tot 17 | Tot 22 | Tot 7 | Tot 48 |
December 2022 - Number of Baths by House Sold (Full - Half)
wdt_ID | marketarea | Subdivision | 2 BTHS | 2-1 BTHS | 3 BTHS | 3-1 BTHS | 4 BTHS | 4-1 BTHS | 5-1 BTHS | Total |
---|---|---|---|---|---|---|---|---|---|---|
1 | Woodforest | Bonterra | 1 | 3 | 0 | 1 | 0 | 0 | 0 | 5 |
2 | Woodforest | Kingsley Square | 0 | 2 | 0 | 0 | 0 | 0 | 0 | 2 |
3 | Woodforest | Noble Greens | 0 | 0 | 0 | 0 | 0 | 1 | 0 | 1 |
4 | Woodforest | Woodforest | 7 | 3 | 13 | 9 | 4 | 3 | 1 | 40 |
Tot 8 | Tot 8 | Tot 13 | Tot 10 | Tot 4 | Tot 4 | Tot 1 | Tot 48 |
The information contained, and the opinions expressed, in this article are not intended to be construed as investment advice. The Grijalva Group, LLC. does not guarantee or warrant the accuracy or completeness of the information or opinions contained herein. Nothing herein should be construed as investment advice. You should always conduct your own research and due diligence and obtain professional advice before making any investment decision. The Grijalva Group LLC. will not be liable for any loss or damage caused by your reliance on the information or opinions contained herein.