TGG

TGG Realty Group

  • Home
  • Listings
    • Active
    • Sold
  • Resources
    • For Sellers
    • For Buyers
  • Sales Statistics
    • The Woodlands Sales
    • The Woodlands Rentals
    • Spring East & Northeast Sales
    • Spring East & Northeast Rentals
    • Woodforest Sales
  • News
  • About Us
  • Contact Us
+1 281 415-5294

The Woodlands Rentals

If you are browsing with mobile smartphone, rotate for better experience

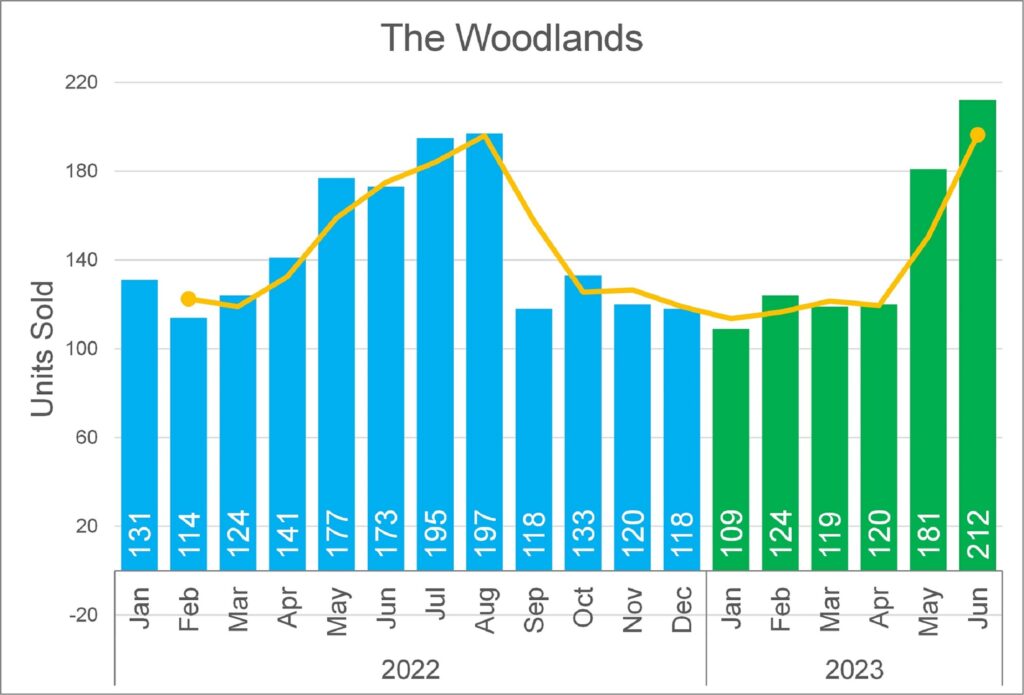
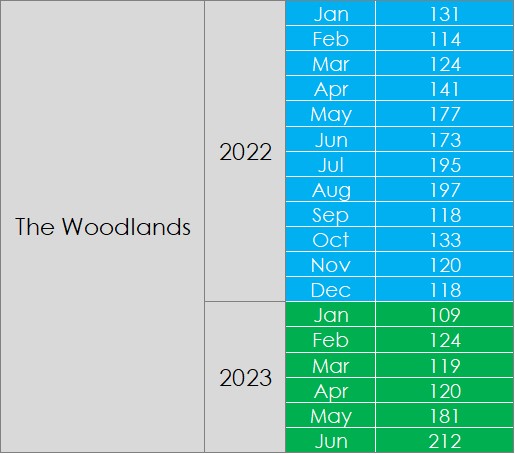
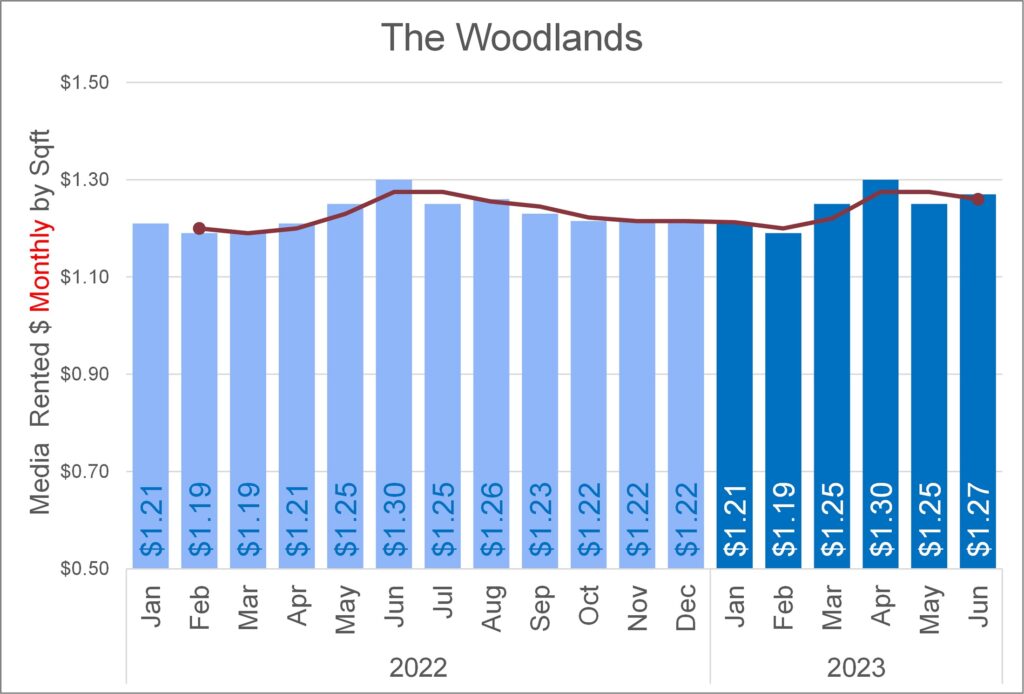
Rented Trend by Month to Month

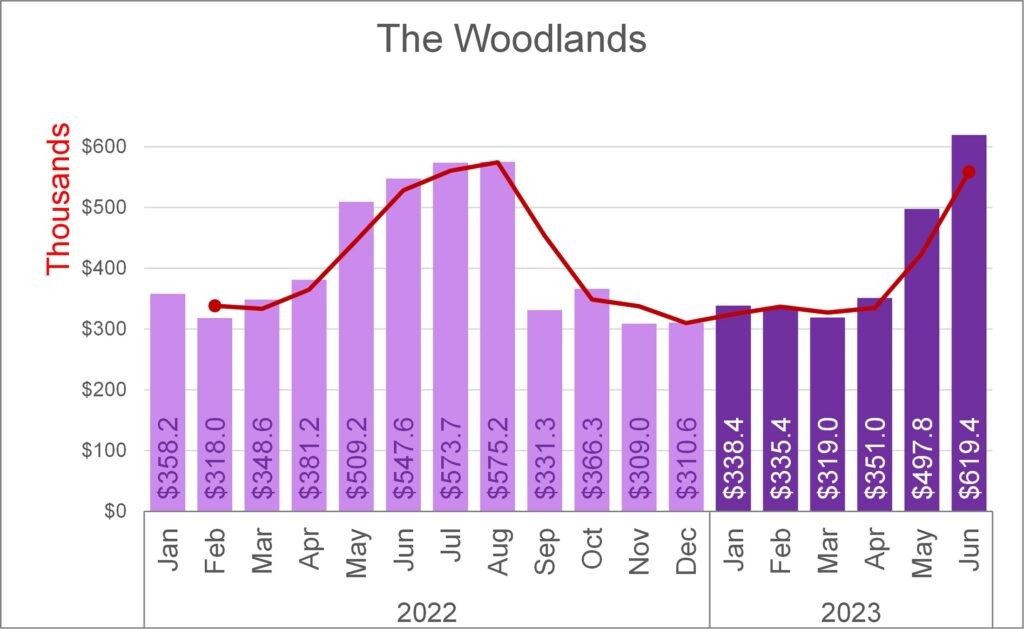
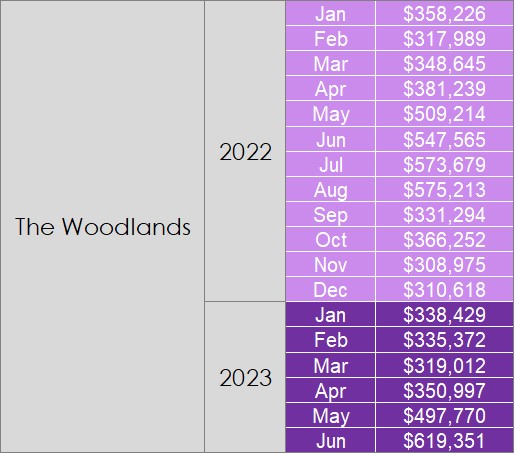
Number of Units Rented by Month 2021 - 2022

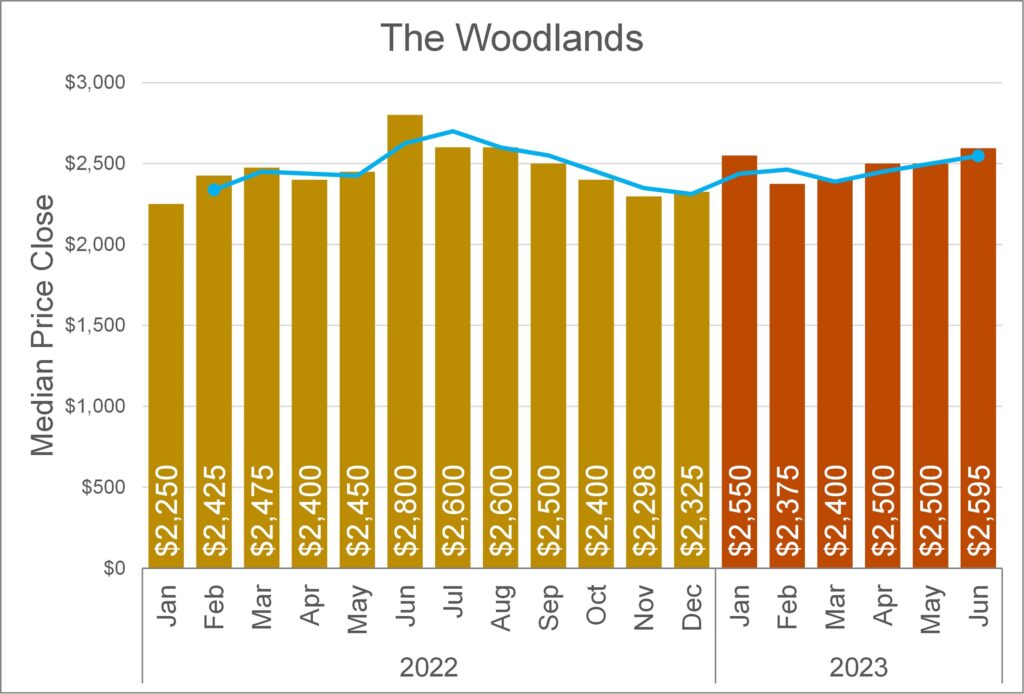
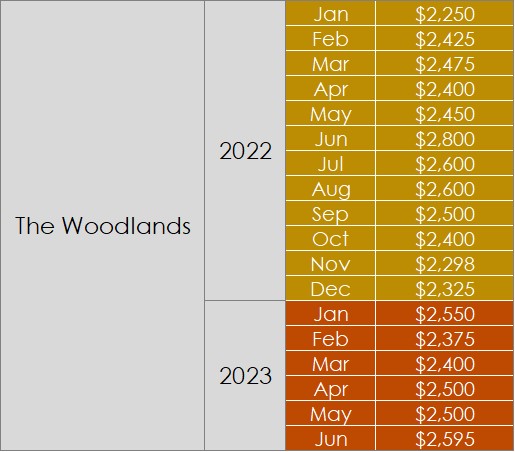
Rented Median Price by Month 2021 - 2022

Subdivision & Villages

Status by Subdivision & Village (December 2022)

wdt_ID marketarea Subdivision & Villages Rented Pending Active Withdraw Total
1 The Woodlands Alden Bridge 28 4 19 13 64
2 The Woodlands Carlton Woods 0 0 1 0 1
3 The Woodlands Cochrans Crossing 14 1 15 6 36
4 The Woodlands College Park 3 1 2 2 8
5 The Woodlands Creekside Park 6 5 3 3 17
6 The Woodlands Creekside Park West 9 1 5 5 20
7 The Woodlands Crrekside Park West 1 0 0 0 1
8 The Woodlands East Shore 3 1 3 3 10
9 The Woodlands Grogans Forest 0 0 2 1 3
10 The Woodlands Grogans Mill 15 4 6 4 29
11 The Woodlands Indian Springs 3 3 5 8 19
12 The Woodlands Panther Creek 11 3 9 5 28
13 The Woodlands Sterling Ridge 18 5 16 8 47
Tot 111 Tot 28 Tot 86 Tot 58 Tot 283

Rented Units, Total Value & Average, Minimum, Maximum Price (December 2022)

wdt_ID marketarea Subdivision & Villages Rented Units Value Minimum Maximum Median Average
1 The Woodlands Alden Bridge 28 67,555 1,450 5,500 2,250 2,413
2 The Woodlands Cochrans Crossing 14 40,095 1,845 5,500 2,600 2,864
3 The Woodlands College Park 3 6,690 1,995 2,500 2,195 2,230
4 The Woodlands Creekside Park 6 17,450 2,000 3,700 2,950 2,908
5 The Woodlands Creekside Park West 9 38,350 2,400 7,750 3,500 4,261
6 The Woodlands Crrekside Park West 1 3,200 3,200 3,200 3,200 3,200
7 The Woodlands East Shore 3 11,000 3,400 4,100 3,500 3,667
8 The Woodlands Grogans Mill 15 34,010 1,565 3,420 2,150 2,267
9 The Woodlands Indian Springs 3 6,900 1,750 3,300 1,850 2,300
10 The Woodlands Panther Creek 11 19,855 1,200 2,575 1,875 1,805
11 The Woodlands Sterling Ridge 18 44,465 1,545 5,000 2,448 2,470
Tot 111 Tot 289,570
Min 1,200
Max 7,750

Houses Rented by Building Size & Subdivision (December 2022)

wdt_ID marketarea Subdivision & Villages 0-999-Sqft 1000-1999-Sqft 2000-2999-Sqft 3000-3999-Sqft 4000-4999-Sqft Total
1 The Woodlands Alden Bridge 0 17 9 2 0 28
2 The Woodlands Cochrans Crossing 0 6 7 0 1 14
3 The Woodlands College Park 0 0 3 0 0 3
4 The Woodlands Creekside Park 0 1 5 0 0 6
5 The Woodlands Creekside Park West 0 0 5 2 2 9
6 The Woodlands Crrekside Park West 0 0 1 0 0 1
7 The Woodlands East Shore 0 0 3 0 0 3
8 The Woodlands Grogans Mill 0 13 1 1 0 15
9 The Woodlands Indian Springs 0 2 0 1 0 3
10 The Woodlands Panther Creek 4 6 1 0 0 11
11 The Woodlands Sterling Ridge 0 9 7 2 0 18
Tot 4 Tot 54 Tot 42 Tot 8 Tot 3 Tot 111

Houses Rented by Price & Subdivision (December 2022)

wdt_ID marketarea Subdivision & Villages $1,000-$1,999 $2,000-$2,999 $3,000-$3,999 $4,000-$4,999 $5,000-$5,999 $6,000-$6,999 $7,000-$7,999 Total
1 The Woodlands Alden Bridge 9 16 1 1 1 0 0 28
2 The Woodlands Cochrans Crossing 2 6 4 1 1 0 0 14
3 The Woodlands College Park 1 2 0 0 0 0 0 3
4 The Woodlands Creekside Park 0 3 3 0 0 0 0 6
5 The Woodlands Creekside Park West 0 1 4 2 0 1 1 9
6 The Woodlands Crrekside Park West 0 0 1 0 0 0 0 1
7 The Woodlands East Shore 0 0 2 1 0 0 0 3
8 The Woodlands Grogans Mill 5 7 3 0 0 0 0 15
9 The Woodlands Indian Springs 2 0 1 0 0 0 0 3
10 The Woodlands Panther Creek 6 5 0 0 0 0 0 11
11 The Woodlands Sterling Ridge 4 12 1 0 1 0 0 18
Tot 29 Tot 52 Tot 20 Tot 5 Tot 3 Tot 1 Tot 1 Tot 111

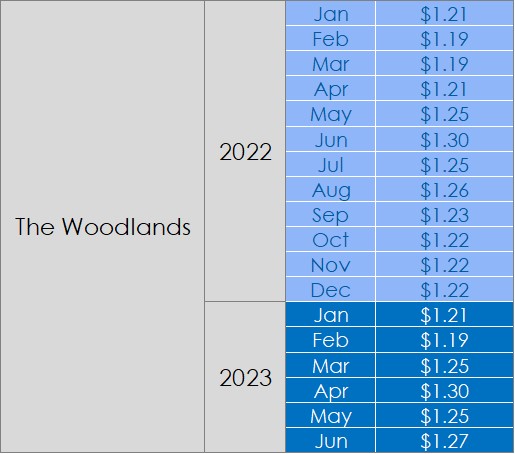
Rented Price per Sqft in $ by Subdivision (December 2022)

wdt_ID marketarea Subdivision $0.75-$0.99 $1.00-$1.24 $1.25-$1.49 $1.5-$1.74 $1.75-$1.99 Total
1 The Woodlands Alden Bridge 3 14 9 2 0 28
2 The Woodlands Cochrans Crossing 0 12 1 0 1 14
3 The Woodlands College Park 3 0 0 0 0 3
4 The Woodlands Creekside Park 0 3 2 1 0 6
5 The Woodlands Creekside Park West 1 2 4 1 1 9
6 The Woodlands Crrekside Park West 0 1 0 0 0 1
7 The Woodlands East Shore 0 0 2 1 0 3
8 The Woodlands Grogans Mill 3 3 5 3 1 15
9 The Woodlands Indian Springs 1 2 0 0 0 3
10 The Woodlands Panther Creek 2 0 5 2 2 11
11 The Woodlands Sterling Ridge 2 9 6 1 0 18
Tot 15 Tot 46 Tot 34 Tot 11 Tot 5 Tot 111

Number of Bedrooms by Subdivision in Rented Houses (December 2022)

wdt_ID marketarea Subdivision & Villages 1 BDRM 2 BDRM 3 BDRM 4 BDRM 5 BDRM Total
1 The Woodlands Alden Bridge 0 1 20 6 1 28
2 The Woodlands Cochrans Crossing 0 0 8 5 1 14
3 The Woodlands College Park 0 0 0 3 0 3
4 The Woodlands Creekside Park 0 0 4 2 0 6
5 The Woodlands Creekside Park West 0 0 1 7 1 9
6 The Woodlands Crrekside Park West 0 0 0 1 0 1
7 The Woodlands East Shore 0 0 3 0 0 3
8 The Woodlands Grogans Mill 0 0 13 2 0 15
9 The Woodlands Indian Springs 0 0 2 0 1 3
10 The Woodlands Panther Creek 1 6 3 1 0 11
11 The Woodlands Sterling Ridge 0 1 11 6 0 18
Tot 1 Tot 8 Tot 65 Tot 33 Tot 4 Tot 111

Number of Baths Full - Half in Rented Houses by Subdivision (December 2022)

wdt_ID marketarea Subdivision & Villages 1 BTH 2 BTHS 2-1 BTHS 3 BTHS 3-1 BTHS 3-2 BTHS 4 BTHS 4-1 BTHS 4-2 BTHS 5-2 BTHS Total
1 The Woodlands Alden Bridge 0 6 19 0 2 0 1 0 0 0 28
2 The Woodlands Cochrans Crossing 0 4 6 1 2 1 0 0 0 0 14
3 The Woodlands College Park 0 0 3 0 0 0 0 0 0 0 3
4 The Woodlands Creekside Park 0 1 4 1 0 0 0 0 0 0 6
5 The Woodlands Creekside Park West 0 0 3 3 1 0 0 0 1 1 9
6 The Woodlands Crrekside Park West 0 0 0 1 0 0 0 0 0 0 1
7 The Woodlands East Shore 0 0 0 0 3 0 0 0 0 0 3
8 The Woodlands Grogans Mill 0 5 9 0 1 0 0 0 0 0 15
9 The Woodlands Indian Springs 0 2 0 0 0 0 0 1 0 0 3
10 The Woodlands Panther Creek 4 5 2 0 0 0 0 0 0 0 11
11 The Woodlands Sterling Ridge 0 4 12 0 1 0 1 0 0 0 18
Tot 4 Tot 27 Tot 58 Tot 6 Tot 10 Tot 1 Tot 2 Tot 1 Tot 1 Tot 1 Tot 111

The information contained, and the opinions expressed, in this article are not intended to be construed as investment advice. The Grijalva Group, LLC. does not guarantee or warrant the accuracy or completeness of the information or opinions contained herein. Nothing herein should be construed as investment advice. You should always conduct your own research and due diligence and obtain professional advice before making any investment decision. The Grijalva Group LLC. will not be liable for any loss or damage caused by your reliance on the information or opinions contained herein.

Contact Us

GDPR Agreement *

Texas Real Estate Commission Consumer Protection Notice

Texas Real Estate Commission (TREC) Information About Brokerage Services IABS is provided

Privacy Policy


We are here for you!


Owning a home is a keystone of wealth… both financial affluence and emotional security.

Suze Orman
January 31, 2023 Tuesday!
TGG
  • Login
Forget Password?

Dynamic title for modals

Are you sure?

Please confirm deletion. There is no undo!