TGG

TGG Realty Group

  • Home
  • Listings
    • Active
    • Sold
  • Resources
    • For Sellers
    • For Buyers
  • Sales Statistics
    • The Woodlands Sales
    • The Woodlands Rentals
    • Spring East & Northeast Sales
    • Spring East & Northeast Rentals
    • Woodforest Sales
  • News
  • About Us
  • Contact Us
+1 281 415-5294

The Woodlands Sales

The Woodlands Sales by Villages & Subdivisions

As always, we strive to keep our friends and clients informed about the housing market in our area. Using information we gathered from the Houston Association of Realtors, we are happy to share with you the information below showing recent developments in the housing market in The Woodlands area.

If you are browsing with mobile smartphone, rotate for better experience.

The Woodlands

Review December 2022 Sales

The Woodlands November Sales
Highlights & Lowlights

Highlights.

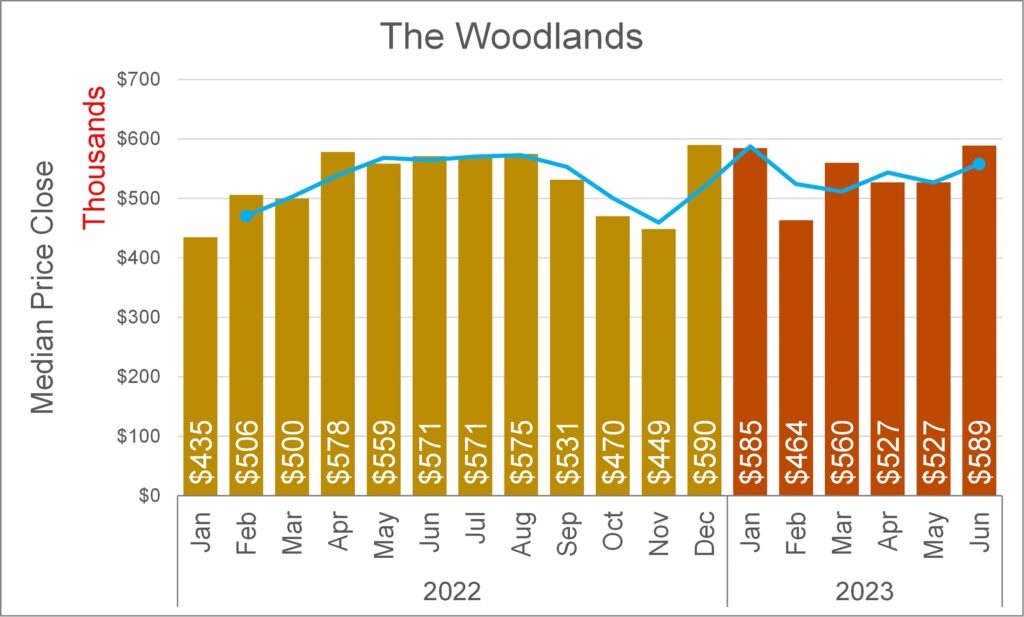
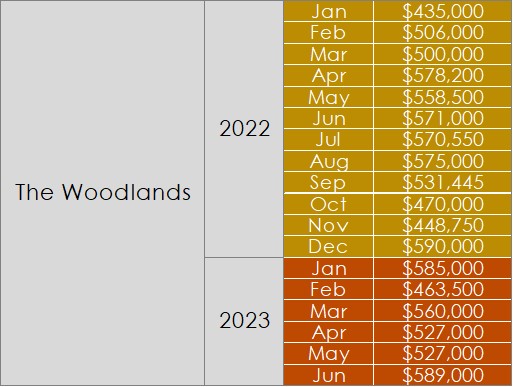
  • The November 2021 median sold compared to November 2022 remains at about the same level of $456,250 to $455,000.
  •  98 Homes in a Sold status, 83 in a Pending status, and 74 in an Active status, which means low inventory on Active properties as of the end of November. 
  • Great time to enter the market because as we are currently seeing, prices are stabilizing and inventory reduced for sale.

Lowlights.

  • The inventory continues to be tight, which is one of the reasons why less units were sold.
  • Also the increase in mortgage rates. 
  • The data shows that until now prices remain above previous year, but more conservatively so.

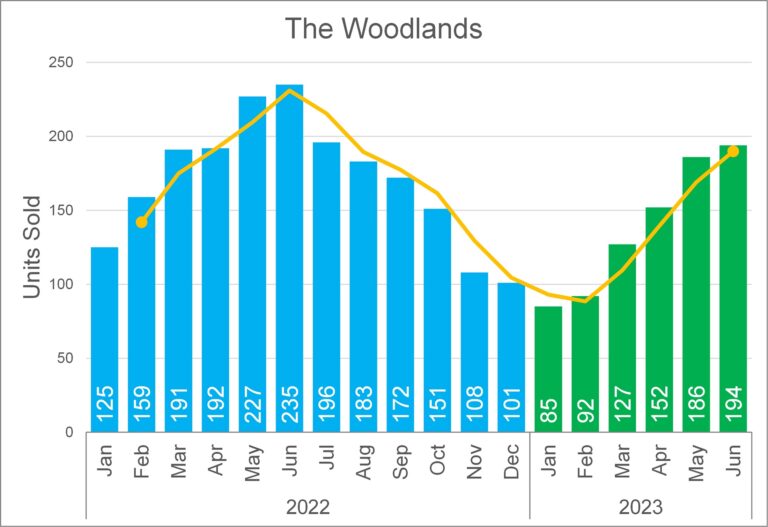
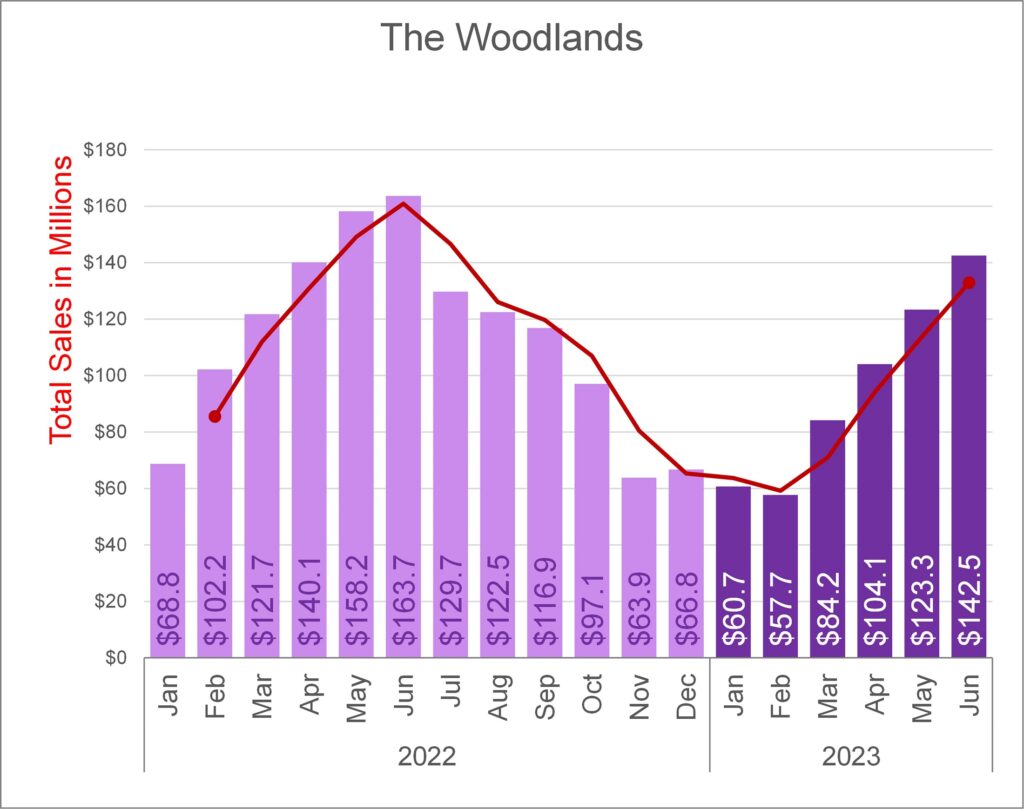
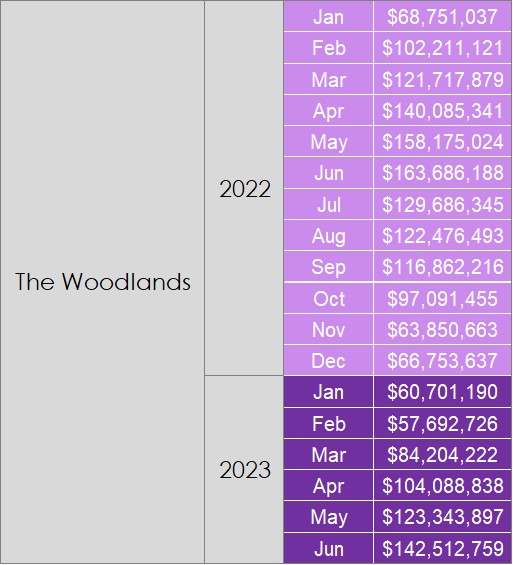
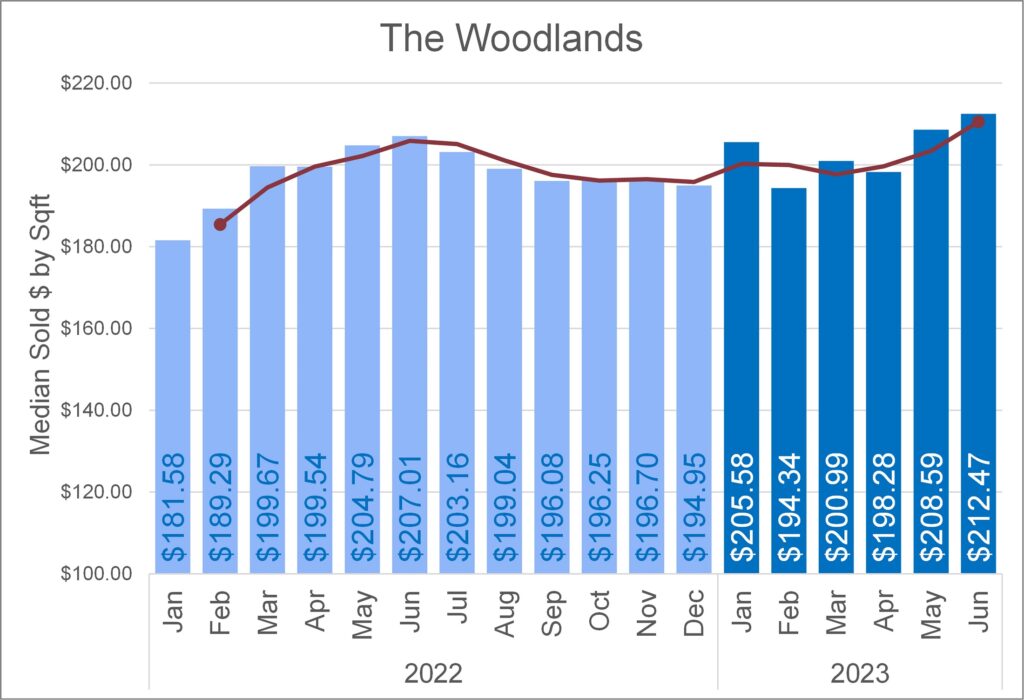
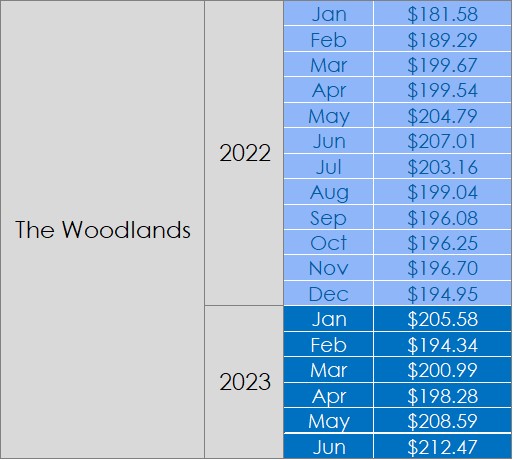
Trend by Month to Month

Map of Sales December 2022

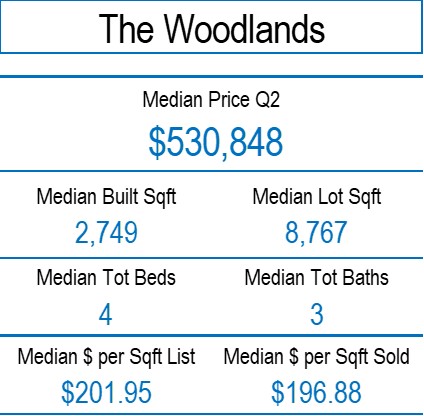
Summary December 2022

wdt_ID Concept Count Values
1 Total Units Sold 98 0
2 Median Sqft Building 2,872 0
3 Avg. Num of Bedrooms 4 0
4 Avg. Total Baths 3 0
5 Median Price 0 593,500
6 Minimum Price 0 225,000
7 Maximum Price 0 2,100,000
8 Median $ Sqft Sold 0 195

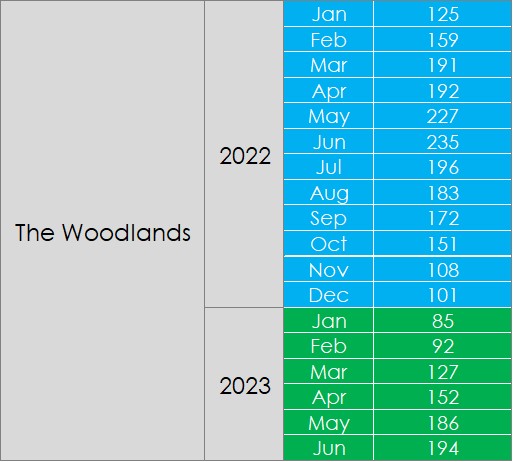
Units Trend by Month

Subdivisions & Villages

December 2022: Status by Village or Subdivision

wdt_ID marketarea Subdivision & Villages Sold Pending Active Withdraw Total
2 The Woodlands Alden Bridge 17 14 8 11 50
3 The Woodlands Carlton Woods 2 1 0 3 6
4 The Woodlands Carlton Woods Creekside 0 0 2 1 3
5 The Woodlands Cochrans Crossing 14 6 10 9 39
6 The Woodlands College Park 2 3 2 4 11
7 The Woodlands Creekside Park 8 7 2 6 23
8 The Woodlands Creekside Park West 7 7 2 7 23
9 The Woodlands Del Webb 1 2 1 2 6
10 The Woodlands East Shore 4 0 0 3 7
11 The Woodlands Grogans Forest 1 1 1 1 4
12 The Woodlands Grogans Mill 9 6 5 13 33
13 The Woodlands Indian Springs 6 4 0 4 14
14 The Woodlands Panther Creek 9 4 4 5 22
19 The Woodlands Sterling Ridge 18 6 5 4 33
20 The Woodlands Waterway 0 1 0 0 1
Tot 98 Tot 62 Tot 42 Tot 73 Tot 275

December 2022: Sold by Village or Subdivision. Average, Minimum, Maximum Closed Price

wdt_ID marketarea Subdivision & Villages Units Total Value Minimum Maximum Median Average
16 The Woodlands Alden Bridge 17 8,533,150 277,000 1,450,000 410,000 501,950
17 The Woodlands Carlton Woods 2 2,690,000 1,290,000 1,400,000 1,345,000 1,345,000
18 The Woodlands Cochrans Crossing 14 8,421,150 367,000 1,260,000 555,000 601,511
19 The Woodlands College Park 2 916,500 384,000 532,500 458,250 458,250
20 The Woodlands Creekside Park 8 7,139,900 664,900 1,250,000 882,500 892,488
21 The Woodlands Creekside Park West 7 4,450,675 487,625 820,050 608,000 635,811
22 The Woodlands Del Webb 1 600,000 600,000 600,000 600,000 600,000
23 The Woodlands East Shore 4 4,518,000 675,000 2,000,000 921,500 1,129,500
24 The Woodlands Grogans Forest 1 834,000 834,000 834,000 834,000 834,000
25 The Woodlands Grogans Mill 9 4,584,999 275,000 908,000 400,000 509,444
26 The Woodlands Indian Springs 6 5,640,300 314,000 2,100,000 678,150 940,050
27 The Woodlands Panther Creek 9 6,595,400 225,000 2,075,000 474,500 732,822
28 The Woodlands Sterling Ridge 18 10,474,813 274,000 1,269,500 511,250 581,934
Tot 98 Tot 65,398,887
Min 225,000
Max 2,100,000

December 2022: Number of Houses Sold by Building Size Grouped by Sqft.

wdt_ID marketarea Subdivision 1,000-1,999-Sqft 2,000-2,999-Sqft 3,000-3,999-Sqft 4,000-4,999-Sqft 5,000-5,999-Sqft 6,000-6,999-Sqft Total
1 The Woodlands Alden Bridge 5 8 3 0 0 1 17
2 The Woodlands Carlton Woods 0 0 0 2 0 0 2
3 The Woodlands Cochrans Crossing 0 7 6 1 0 0 14
4 The Woodlands College Park 0 2 0 0 0 0 2
5 The Woodlands Creekside Park 0 0 3 5 0 0 8
6 The Woodlands Creekside Park West 0 2 4 1 0 0 7
7 The Woodlands Del Webb 0 1 0 0 0 0 1
8 The Woodlands East Shore 0 2 2 0 0 0 4
9 The Woodlands Grogans Forest 0 0 1 0 0 0 1
10 The Woodlands Grogans Mill 2 6 0 1 0 0 9
11 The Woodlands Indian Springs 2 0 2 1 1 0 6
12 The Woodlands Panther Creek 2 3 2 2 0 0 9
13 The Woodlands Sterling Ridge 3 7 5 3 0 0 18
Tot 14 Tot 38 Tot 28 Tot 16 Tot 1 Tot 1 Tot 98

December 2022: Number of Houses Sold by Property Type.

wdt_ID marketarea Subdivision & Villages Single-Family Townhouse_Condo Total
1 The Woodlands Alden Bridge 15 2 17
2 The Woodlands Carlton Woods 2 0 2
3 The Woodlands Cochrans Crossing 14 0 14
4 The Woodlands College Park 2 0 2
5 The Woodlands Creekside Park 8 0 8
6 The Woodlands Creekside Park West 7 0 7
7 The Woodlands Del Webb 1 0 1
8 The Woodlands East Shore 4 0 4
9 The Woodlands Grogans Forest 1 0 1
10 The Woodlands Grogans Mill 9 0 9
11 The Woodlands Indian Springs 6 0 6
12 The Woodlands Panther Creek 9 0 9
13 The Woodlands Sterling Ridge 15 3 18
Tot 93 Tot 5 Tot 98

December 2022: Number of Houses Sold by Closed Price

wdt_ID marketarea Subdivision $100-$299 KUSD $300-$499 KUSD $500-$699 KUSD $700-$899 KUSD $900-$1,099 KUSD $1,100-$1,299 KUSD $1,300-$1,499 KUSD $1,500-$1,699 KUSD $1,900-$2,099 KUSD $2,100-$2,299 KUSD Total
1 The Woodlands Alden Bridge 2 10 3 1 0 0 1 0 0 0 17
2 The Woodlands Carlton Woods 0 0 0 0 0 1 1 0 0 0 2
3 The Woodlands Cochrans Crossing 0 6 5 2 0 1 0 0 0 0 14
4 The Woodlands College Park 0 1 1 0 0 0 0 0 0 0 2
5 The Woodlands Creekside Park 0 0 1 3 3 1 0 0 0 0 8
6 The Woodlands Creekside Park West 0 1 4 2 0 0 0 0 0 0 7
7 The Woodlands Del Webb 0 0 1 0 0 0 0 0 0 0 1
8 The Woodlands East Shore 0 0 1 1 1 0 0 0 1 0 4
9 The Woodlands Grogans Forest 0 0 0 1 0 0 0 0 0 0 1
10 The Woodlands Grogans Mill 2 4 0 2 1 0 0 0 0 0 9
11 The Woodlands Indian Springs 0 2 1 1 0 0 0 1 0 1 6
12 The Woodlands Panther Creek 1 4 0 1 2 0 0 0 1 0 9
13 The Woodlands Sterling Ridge 1 8 5 2 1 1 0 0 0 0 18
Tot 6 Tot 36 Tot 22 Tot 16 Tot 8 Tot 4 Tot 2 Tot 1 Tot 2 Tot 1 Tot 98

December 2022: Number of Houses Sold by $ per Sqft. Price Band

wdt_ID marketarea Subdivision & Villages $100-$149 $150-$199 $200-$249 $250-$299 $300-$349 $350-$399 $400-$450 $550-$$600 Total
1 The Woodlands Alden Bridge 0 11 6 0 0 0 0 0 17
2 The Woodlands Carlton Woods 0 0 0 1 1 0 0 0 2
3 The Woodlands Cochrans Crossing 0 10 3 1 0 0 0 0 14
4 The Woodlands College Park 0 1 1 0 0 0 0 0 2
5 The Woodlands Creekside Park 0 3 3 2 0 0 0 0 8
6 The Woodlands Creekside Park West 0 5 2 0 0 0 0 0 7
7 The Woodlands Del Webb 0 0 1 0 0 0 0 0 1
8 The Woodlands East Shore 0 0 0 1 1 1 0 1 4
9 The Woodlands Grogans Forest 0 0 1 0 0 0 0 0 1
10 The Woodlands Grogans Mill 0 6 1 2 0 0 0 0 9
11 The Woodlands Indian Springs 0 3 1 0 1 1 0 0 6
12 The Woodlands Panther Creek 0 2 6 0 0 0 1 0 9
13 The Woodlands Sterling Ridge 1 14 2 1 0 0 0 0 18
Tot 1 Tot 55 Tot 27 Tot 8 Tot 3 Tot 2 Tot 1 Tot 1 Tot 98

December 2022: Number of Bedrooms by House Sold

wdt_ID marketarea Subdivision & Villages 2 BDRM 3 BDRM 4 BDRM 5 BDRM 6 BDRM Total
1 The Woodlands Alden Bridge 1 8 6 1 1 17
2 The Woodlands Carlton Woods 0 0 2 0 0 2
3 The Woodlands Cochrans Crossing 0 3 10 1 0 14
4 The Woodlands College Park 1 1 0 0 0 2
5 The Woodlands Creekside Park 0 0 2 6 0 8
6 The Woodlands Creekside Park West 0 3 3 1 0 7
7 The Woodlands Del Webb 1 0 0 0 0 1
8 The Woodlands East Shore 0 3 1 0 0 4
9 The Woodlands Grogans Forest 0 1 0 0 0 1
10 The Woodlands Grogans Mill 1 4 4 0 0 9
11 The Woodlands Indian Springs 0 1 3 2 0 6
12 The Woodlands Panther Creek 1 3 4 0 1 9
13 The Woodlands Sterling Ridge 0 4 8 6 0 18
Tot 5 Tot 31 Tot 43 Tot 17 Tot 2 Tot 98

December 2022: Number of Total Baths by House Sold (Full - Half)

wdt_ID marketarea Subdivision & Villages 1-1 BTHS 2 BTHS 2-1 BTHS 2-2 BTHS 3 BTHS 3-1 BTHS 3-2 BTHS 4 BTHS 4-1 BTHS 4-2 BTHS 5-1 BTHS 5-2 BTHS 6-1 BTHS Total
1 The Woodlands Alden Bridge 0 5 6 0 0 4 0 0 1 0 1 0 0 17
2 The Woodlands Carlton Woods 0 0 0 0 0 0 0 0 2 0 0 0 0 2
3 The Woodlands Cochrans Crossing 0 1 6 0 0 6 0 0 1 0 0 0 0 14
4 The Woodlands College Park 0 1 1 0 0 0 0 0 0 0 0 0 0 2
5 The Woodlands Creekside Park 0 0 0 0 0 1 0 1 3 0 2 0 1 8
6 The Woodlands Creekside Park West 0 0 1 0 1 4 0 1 0 0 0 0 0 7
7 The Woodlands Del Webb 0 0 1 0 0 0 0 0 0 0 0 0 0 1
8 The Woodlands East Shore 0 0 1 0 0 1 1 0 1 0 0 0 0 4
9 The Woodlands Grogans Forest 0 0 0 0 0 0 0 1 0 0 0 0 0 1
10 The Woodlands Grogans Mill 0 2 3 1 1 1 1 0 0 0 0 0 0 9
11 The Woodlands Indian Springs 0 2 0 0 0 2 0 0 0 0 1 1 0 6
12 The Woodlands Panther Creek 1 2 2 0 0 2 1 0 0 0 1 0 0 9
13 The Woodlands Sterling Ridge 0 3 5 0 1 6 0 0 0 1 1 1 0 18
Tot 1 Tot 16 Tot 26 Tot 1 Tot 3 Tot 27 Tot 3 Tot 3 Tot 8 Tot 1 Tot 6 Tot 2 Tot 1 Tot 98

The information contained, and the opinions expressed, in this article are not intended to be construed as investment advice. The Grijalva Group, LLC. does not guarantee or warrant the accuracy or completeness of the information or opinions contained herein. Nothing herein should be construed as investment advice. You should always conduct your own research and due diligence and obtain professional advice before making any investment decision. The Grijalva Group LLC. will not be liable for any loss or damage caused by your reliance on the information or opinions contained herein.

Contact Us

GDPR Agreement *

Texas Real Estate Commission Consumer Protection Notice

Texas Real Estate Commission (TREC) Information About Brokerage Services IABS is provided

Privacy Policy


We are here for you!


Owning a home is a keystone of wealth… both financial affluence and emotional security.

Suze Orman
January 31, 2023 Tuesday!
TGG
  • Login
Forget Password?

Dynamic title for modals

Are you sure?

Please confirm deletion. There is no undo!