WHAT IS FIRPTA
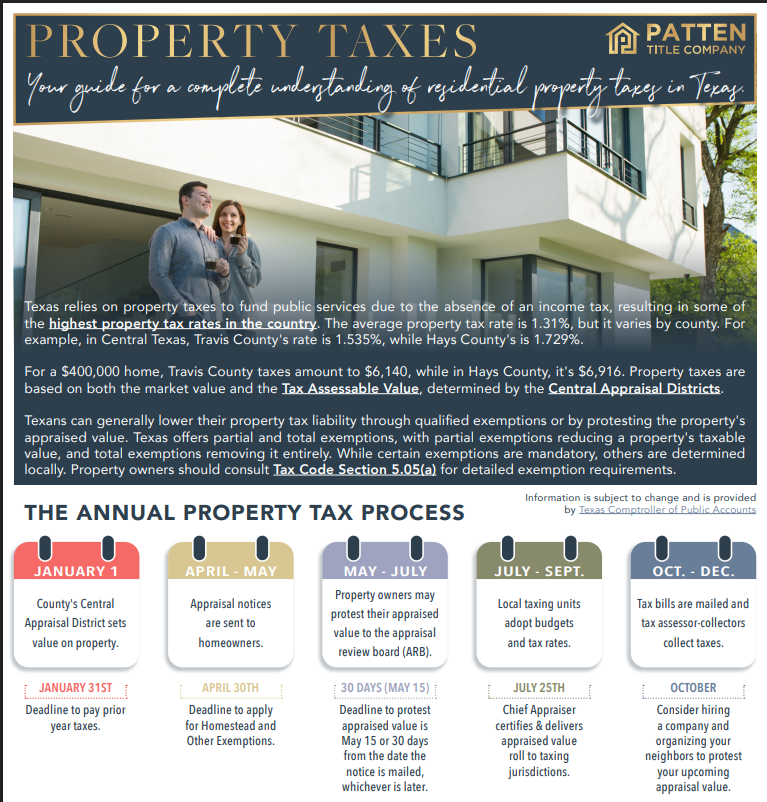
FIRPTA is an acronym for “Foreign Investment in Real Property Tax.” The law was established in 1980 to allow the government to collect taxes when theseller isn’t a U.S. citizen. For instance, sellers from the United States must paycapital gains taxes for any profitable real estate investment in the country.
However, because a foreign investor isn’t subject to the same tax laws as a United States citizen, the IRS shifts the obligation for collecting the tax to thebuyer. FIRPTA was designed to even the tax playing field for U.S. investors.

It’s always important to work with a title company that understands FIRPTA.
While the seller is officially responsible for the FIRPTA tax, it’s the buyer’s job to make sure the money is set aside. According to the IRS, the buyer is what’s known as the “withholding agent.”
How much should you set aside? Typically, 15-21% of the price of the transaction should be carved out for tax, depending on the price of the property and if the seller is an individual or a corporation. A corporate buyer or business buying aproperty is subject to the same rules.

All the rights are property of PATTEN TITLE COMPANY
Renting vs. Buying: The Numbers Might Surprise You
Renting can feel like the easier choice right now. There’s no big down payment. No dealing with surprise repairs. And no long-term commitment.
But then your rent goes up again. And again. And suddenly the thing that seemed flexible starts looking… expensive, especially considering you’re not building any equity. And once that happens, it’s easy to feel a little trapped in the cycle.
That’s because there’s so much chatter today about how buying a home isn’t affordable. But the truth is, the math may work out better than you’d expect based on what’s changed recently.
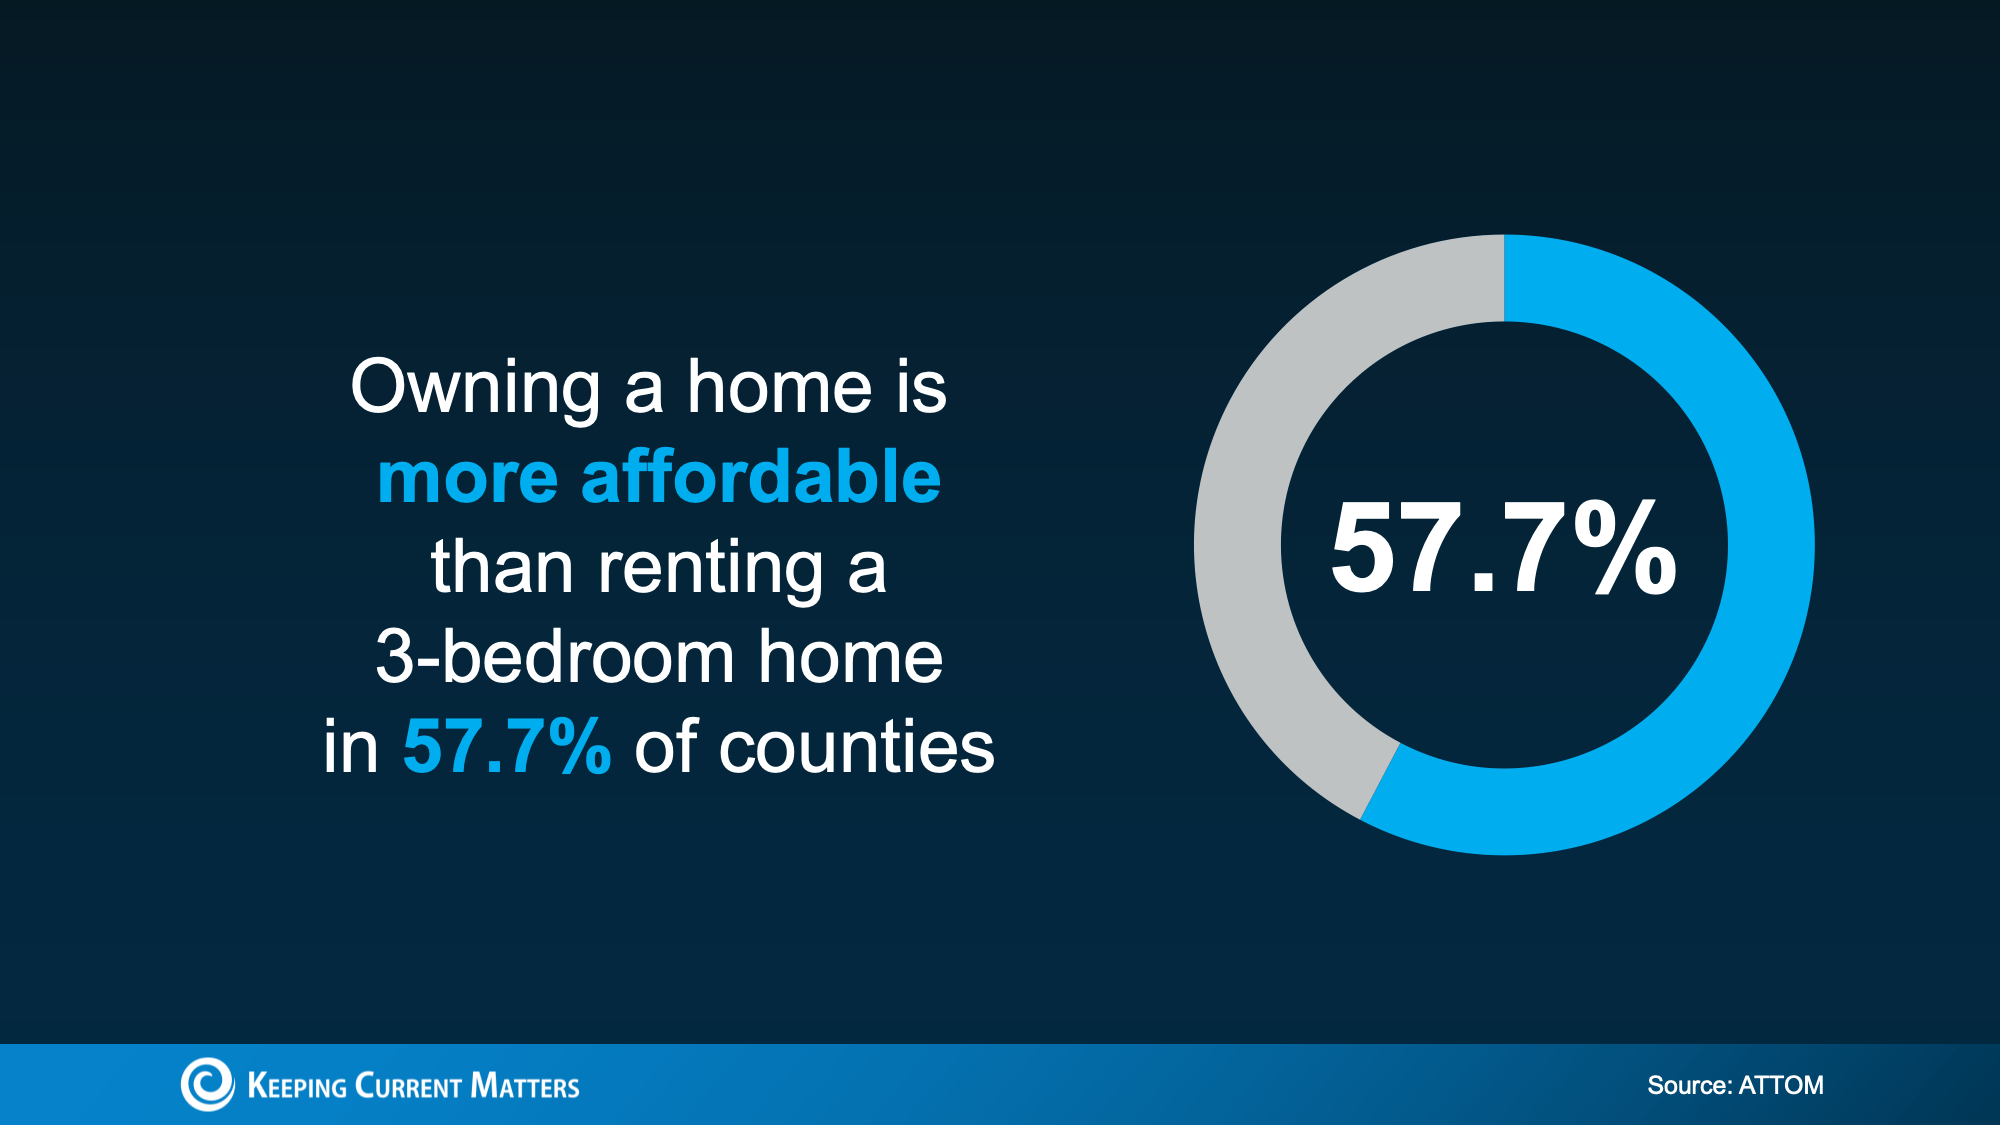
Buying Is More Affordable Than Renting in Many Areas
In a lot of places today, owning a home actually costs less each month than renting a 3-bedroom home. And recent data from ATTOM shows that’s true in nearly 58% of counties across the U.S. (see chart below).
And that’s after you factor in things like insurance and typical maintenance costs.
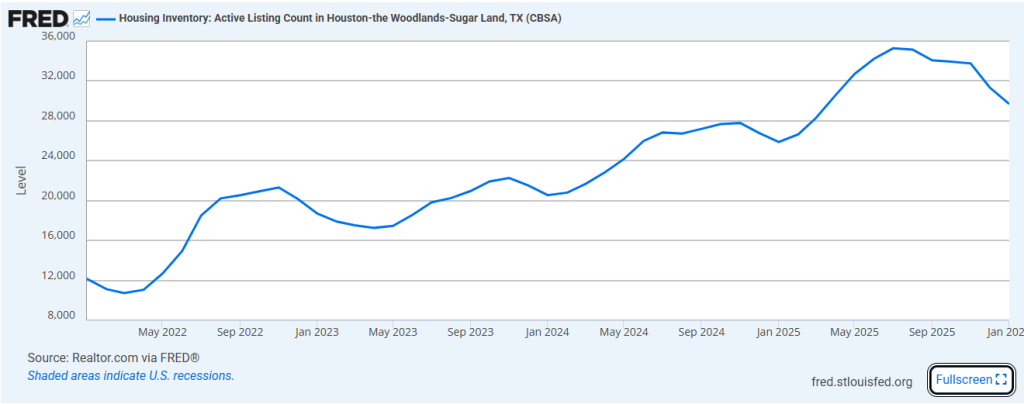
 In other words, even though it may feel like a bit of a shock, the numbers show rent often stretches monthly budgets more than owning does. That’s thanks to slower home price growth, more homes for sale, and monthly mortgage payments starting to ease as rates come down.
Affordability Still Varies by Region
Now, even though nationally the balance has shifted, that doesn’t mean buying is more affordable in every market or for every renter.
While buying is more affordable than renting in nearly 58% of counties nationwide, that share looks different depending on your region (see graph below):
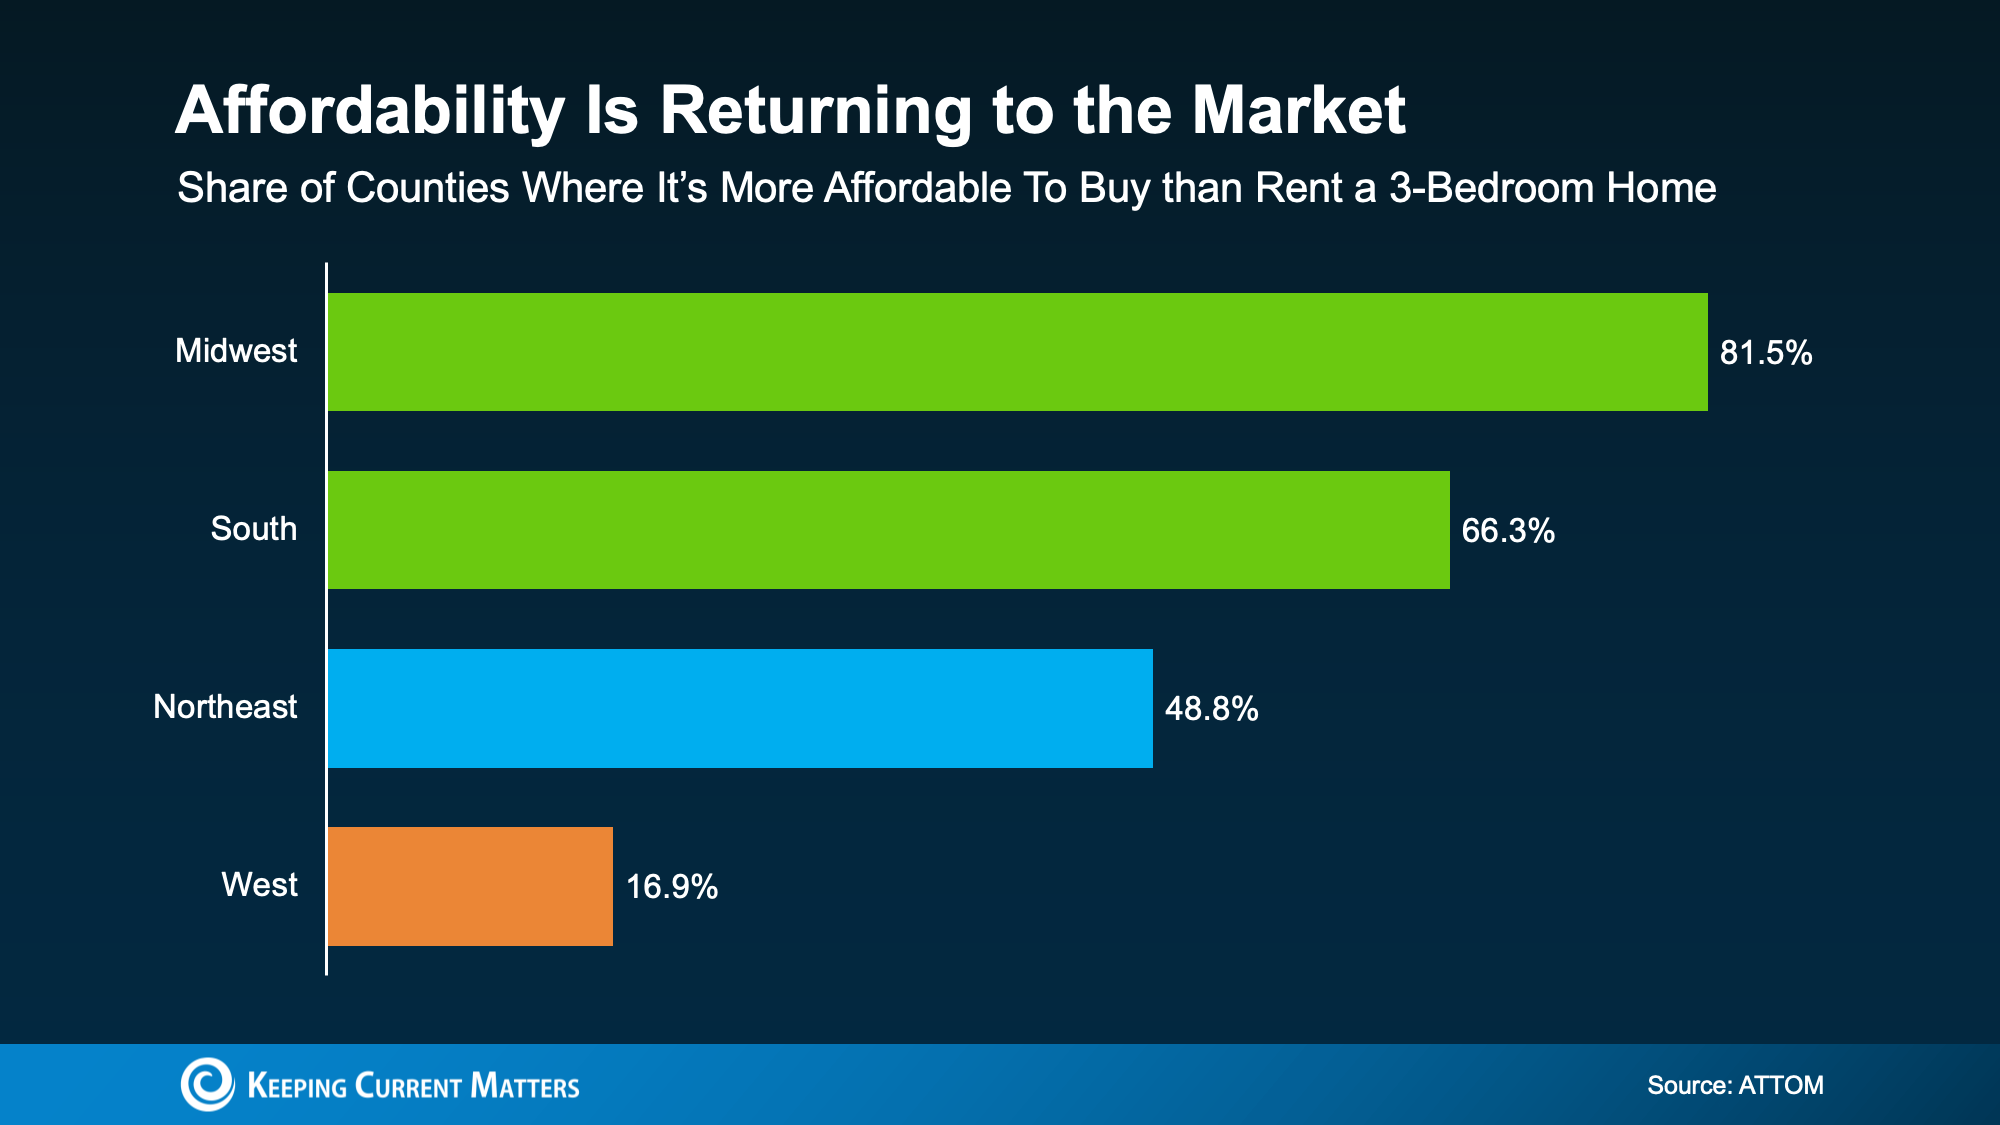
The biggest improvement is happening in the Midwest and South. But if you’re living in the West, things could still feel tight.
The takeaway? How affordable buying is really depends on where you live. And the only way to know how this plays out where you live is to look at the numbers locally.
So, What’s Still Holding Buyers Back?
Maybe you’re nodding along so far but thinking, “Okay, but I still can’t afford the upfront costs.” If that’s your reaction, you’re not the only one.
For many renters, the biggest hurdle isn’t the monthly payment alone. It’s the down payment, too.
But you’re not out of options. Here’s the part most people don’t hear enough about: there are thousands of down payment assistance programs available across the country, and many buyers qualify without realizing it.
And the average benefit? Roughly $18,000.
That kind of support can help cover part of your down payment or closing costs, which means you may not need to save nearly as much as you think to get started.
When you combine that with monthly payments that may work better than expected, especially as rates continue to ease and prices cool, buying may feel far more realistic than it looks at first glance.
Bottom Line
The point isn’t that everyone should rush out and buy a home tomorrow.
It’s that renting isn’t always the more affordable option people assume it is – and buying may be more realistic than it feels once you look at the full picture.
If you’re renting and feeling stuck in the “someday” loop, it might be worth a simple conversation with a local real estate agent or lender. Just a chance to see what’s possible and whether it makes sense for you
Allrigths are reserved to: Keeping Current Matters
Borrowing costs haven’t fallen below 6% since 2022

Key takeaways
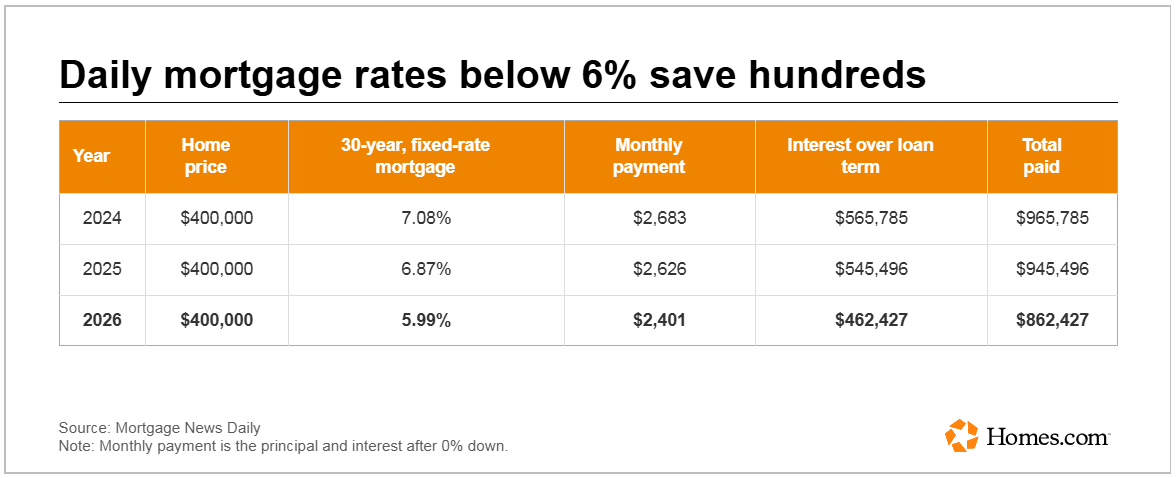
- The 30-year, fixed-rate mortgage dipped to 5.99% on Monday — its first time below 6% since September 2022.
- The decline reflects a gradual, sustainable improvement in the bond and mortgage-backed securities markets, rather than a reaction to a single economic headline, according to Mortgage News Daily.
- The National Association of Realtors estimates that lower mortgage rates could bring an additional 550,000 homebuyers to the market this year.
The 30-year, fixed-rate mortgage fell below 6% for the first time in nearly three-and-a-half years.
As of Monday afternoon, Mortgage News Daily reported a 5.99% rate, down five basis points from Friday. The 15-year, fixed-rate mortgage was unchanged at 5.6%.
It’s the first time since September 2022 that the 30-year rate has been in the 5% range, a change that could save borrowers hundreds of dollars a month.
Unlike other recent mortgage rate lows, Monday’s decrease was the result of a “gradual and…sustainable” change, according to Matthew Graham, chief operating officer at Mortgage News Daily.
“There’s no new news causing the improvement,” he wrote in a blog post. “The broader bond market has gradually improved to the best levels since November and the mortgage-backed securities market (the bonds that directly dictate mortgage rates) have performed better than normal.”
The mortgage market tracks closely with the bond market, which has been trending positive for the last few months.
That’s partly because investors are “looking for a safe haven” amidst economic and geopolitical uncertainty, and bonds are generally considered a more prudent investment, according to Dan Frio, a lender with PBT Bancorp in Kentucky.
With that in mind, Frio told Homes.com News that he expects rates will probably stay in a fairly narrow range, at least in the immediate future.
More homebuyers can likely enter the market now
Monday’s rate could save some borrowers up to hundreds of dollars on their monthly payments — but more than that, just seeing a five could have psychological implications for both homebuyers and refinancers.
“It’s like a light switch,” Frio said.
Indeed, the 2020s have been a sort of game of tug-of-war between lenders and borrowers. On one side, borrowers are holding out hope for lower mortgage rates like those seen at the start of the decade during the COVID-19 pandemic. On the other hand, lenders and experts insist that those low borrowing costs were a blip unlikely to ever be seen again.
That said, a 5% rate could pull some homebuyers off the sidelines. It could also provide significant savings for homeowners sitting on a 7% or higher rate.
Last week, Lawrence Yun, chief economist at the National Association of Realtors, noted that an additional 5.5 million households that couldn’t afford a mortgage last year could now qualify at today’s lower rates.
“Most newly qualifying households do not act immediately, but based on experience, about 10% could enter the market — potentially adding roughly 550,000 new homebuyers this year compared with last year,” he said in a statement Thursday.
A lower rate doesn’t always mean lower payments
Still, it’s important that borrowers evaluate their options before making a decision, according to Brad Case, chief residential economist at Homes.com.
“Borrowers need to know that they may be able to do even better simply by contacting several lenders or mortgage brokers and asking which rate they’re willing to offer,” he said in an email. “Shopping around can give you a better interest rate than the average — so, for example, maybe you could get 5.88% instead of 5.99%.”
Frio added that borrowers should also pay close attention to their actual fees, not just the rate.
“A lower rate doesn’t always mean lower payments,” he said.